Portland’s Housing Supply – How Dense, Old, and Big?
Updated 05/2024.
How old are Portland homes? How many were built in the 1970s? What is the average number of bedrooms in a Portland home? What percentage of Portland homes are owner-occupied? We explore all of these topics and more to provide you with a comprehensive understanding of the Portland housing market.
We analyzed data from the US Census and from two government-related reporting institutions focused on housing development: The State of Housing in Portland and The Portland Plan. The State of Housing in Portland report provided by the Portland Housing Bureau is an annual report that was last completed in 2022. It provides stakeholders and policymakers with a deep look at Portland’s housing market by neighborhood, housing type, and affordability. The report looks at all 299,502 housing units (homes, apartments, condos, and trailers) across Portland.
“The Portland Plan,” created by the Bureau of Planning and Sustainability, outlines local housing goals. It focuses on making Portland “prosperous, healthy, educated, and equitable.” This includes improving housing affordability, health and safety, household economic security, and neighborhood centers.
Where the Single-Family Homes are in Portland
Since Portland is a pretty big city, real estate agents usually refer to six major subareas: Northwest, Downtown, and West Portland are on the west side of the Willamette River. Northeast, North and Southeast on the east side of the Willamette, with Burnside Avenue dividing the city north and south.
Each subarea has a unique housing profile. The Housing Supply Analysis report found that Southeast Portland contains nearly 30% of all housing units in the city! This is surprising because it covers only 15% of the City’s land area, making it the most densely populated area. Downtown Portland accommodates just over 4% of Portland’s housing units, most of them apartments. Meanwhile, North Portland, though it takes up 26% of the total land area of the city, is mostly industrial and contains just 10% of all housing units.
Average Age of a Home in Portland
According to US Census data, 26.7% of Portland housing units were built prior to 1940 and a further 7.7% were added between the 1940s and 1950. After that time, housing stock stayed between 6 and 10% until the decade of 2010, when experienced a boom of 12% . A full look at the decade of 2020 is still to come.
| Decade | Number of Homes Built | Data Year | 2019 Percentage | Data Year | 2022 Percentage |
| Before 1939 | 81,606 | 2019 | 27.6% | 2022 | 26.7% |
| 1940s | 23,371 | 2019 | 7.2% | 2022 | 7.7% |
| 1950s | 31,725 | 2019 | 11.8% | 2022 | 10.4% |
| 1960s | 24,613 | 2019 | 10% | 2022 | 8.1% |
| 1970s | 29,491 | 2019 | 11.1% | 2022 | 9.7% |
| 1980s | 18,716 | 2019 | 6.8% | 2022 | 6.1% |
| 1990s | 23,314 | 2019 | 8.7% | 2022 | 7.6% |
| 2000s | 31,716 | 2019 | 9.7% | 2022 | 10.4% |
| 2010s | 3,424 | 2019 | Incomplete | 2022 | 12.1% |
The increase in residential construction since 2000 has been mostly apartment units, not single-family homes. A large chunk of the residential houses we see on the Portland real estate market today were originally built in the boom years of the 1930s, 40s, and 50s. All homes from those decades make up nearly 45% of all available homes in Portland. Most have been added to and remodeled since their original construction, and some would even pass as newer homes. Overall, the construction quality of these older homes is good, though there is always room for improvement, especially in energy efficiency.
Portland’s older-than-average home profile gives the city a special flavor and charm. You can drive through Portland neighborhoods and see the signature architectural styles that evolved through the 20th century, from 1920s bungalows to 1960s ranch houses. Ask your buyers’ agent specialist — we’ll be happy to give you a historical tour!
Changes to Portland Homeownership Profile
A homeownership rate is the percentage of owner-occupied homes in a given area. Homes are either owned or rented. The homeownership rate can indicate the level of stability in a community and the number of families versus single people living there.
Portland has a history of lower homeownership rates than the national average, and it is slowly decreasing. In 2007, when the Portland Housing Supply Analysis was published, 57% of Portland residents owned their own home. (The national average was, and remains, at 67%.) As of 2022, it sits at 50.9%.
That’s just the overall picture of Portland, though. Each neighborhood has its own ratio of owner-occupied to rental homes, with some pockets at or above national levels.
Renovating and Weatherizing
According to the 2022 US Census data, Portland’s housing stock is primarily two-and three-bedroom homes. Three bedrooms lead the way with 92,271 three-bedrooms, followed by 82,490 two-bedrooms. However, another 35,687 have four or more bedrooms.
Because the majority of demand is for housing that can accommodate singles and small families, renovations that convert existing, larger homes into duplexes or even triplexes (thus increasing the total number of housing units available) are possible. Portland’s housing code was recently overhauled to allow for such “missing middle” housing construction while preserving historic buildings.
The analysis also found close to 140,000 homes in Portland need weatherization. Again, an aging housing stock means that major repairs are now due for many Portland homes. With new Portland regulations on the books requiring home energy scores before a home is sold within the City of Portland boundaries, it’s a great time to perform vital upgrades to these homes, ensuring they’ll be great places to live for the next several decades.
The Future of Portland’s Housing Supply is more High-Rise Apartments and ADUs
With all the strife and struggles Portland has seen over the past few years, some are writing the city off as unfixable. But many others aren’t buying the gloom and doom scenario. In fact, we stand to see a few new apartment complexes and housing solutions in Portland neighborhoods.
The new apartments will aid with housing needs within the city’s borders and will serve various income needs. Portland, like other areas of the country, is experiencing more disparity, and the city is addressing both ends of the spectrum.
On one end, Portland is becoming wealthier and more educated. As of the latest State of Housing in Portland report, 36.4% of households made more than $100,000 per year in 2020, and more than half of residents over age 18 have a bachelor’s degree or higher.
On the other end of the spectrum, disparities in income and education exist between established demographic groups, as well as renters and homeowners. Most economic groups are also experiencing a larger gap between household income and housing costs. All of these reasons have spurred the city to focus more strongly on housing affordability.
The Buildable Land Inventory (BLI), an assessment of Portland’s development capacity, estimates that the city has a capacity for 236,977 new housing units, of which 90% are in mixed-use and multi-dwelling zones. To this end, the city continues its goal of creating “complete neighborhoods” consisting of city homes that provide easy, walkable, and bikeable access to services and resources for residents. The neighborhoods include schools, libraries, grocery stores, and parks.
Of all housing, currently, about 64% of the total housing unit capacity is in complete neighborhoods. The Portland Plan goal is that by 2035, 80% of Portlanders live in healthy, complete neighborhoods.
A drawback of the complete neighborhoods is the displacement of residents living in lower-income areas. Currently, 42% of the capacity is in areas of high economic vulnerability risk. However, Portland continues to produce unprecedented amounts of affordable housing to address this issue. Additionally, Portland’s Residential Infill Project Part 2 began in 2022, allowing for more attached houses and cottage clusters across all neighborhoods.
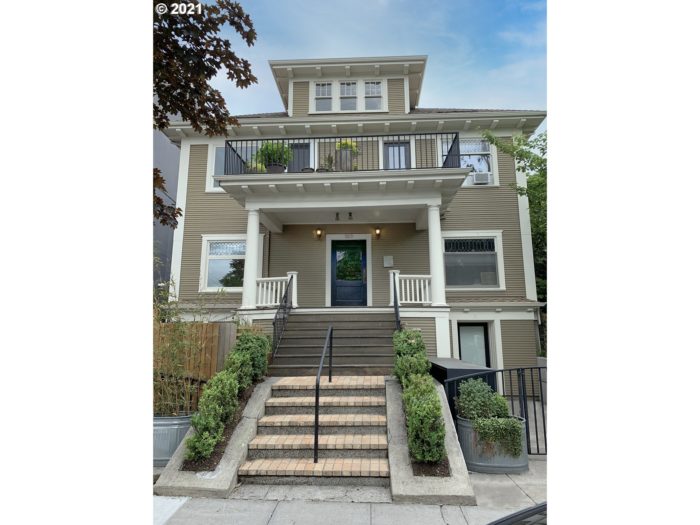
Some people might be concerned about Portland becoming overbuilt with structures that will diminish the city’s charm, but the City of Portland is committed to an aesthetic that maintains its historic character and beauty. Take a look at the Craftsman homes below and see what we mean. Can you tell which one is new and which one is renovated?
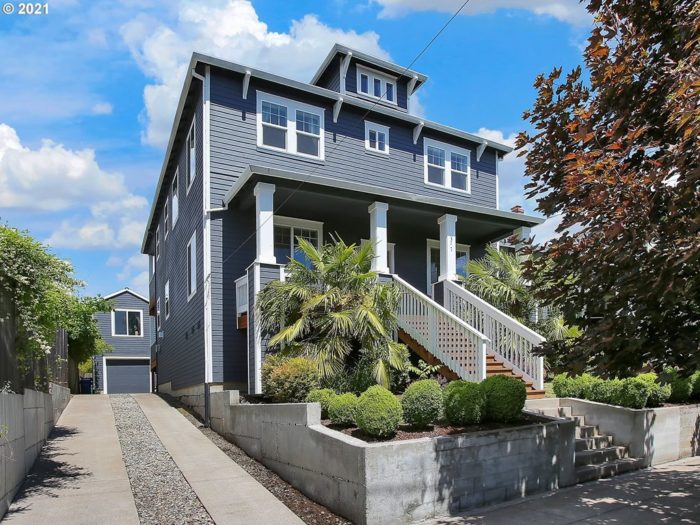
Oregon Housing Legislation, Recent Policies Affecting Portland’s Residential Aesthetic
By law, Oregon cities update a Housing Needs Analysis (HNA) every six years. The goal of the HNA is to forecast housing needs in the state for 20 years.
In December 2023, the City of Portland adopted the 2045 Housing Needs Analysis, which set plans for 120,560 more housing units by 2045. The goal is based on Metro’s 2019 regional forecast and adjustments for vacancy rates, vacation homes, historic underproduction, and housing for the homeless population.
The city’s Housing Production Strategy (HPS) sets actions supporting the HNA’s goals, including construction and ways to measure and report on development. The HPS focuses strongly on ensuring fair and equitable housing, which is especially relevant now as rising costs and declining incomes are rising for both the low and middle classes.
Some legislation has been introduced in recent years to help manage Portland’s housing issues. We’re seeing initiatives directed away from single-family housing, new ways of speeding up the approval process, and new incentives for builders.
■ House Bill 2001—In 2019, Oregon passed House Bill 2001, which bans single-family zoning in cities with populations over 10,000. This means that Portland can no longer prevent developments with multiple units, even in neighborhoods with primarily single-family detached houses. In 2023, Governor Tina Kotek also signed the bill with changes to the eviction process for rentals.
■ Residential Infill Project (RIP1 and RIP2)—In August 2020, the Portland City Council approved the first phase of the Residential Infill Project. This means that single-family homeowners with ample lot space can add more housing to their properties. RIP2 allows for even more attached houses and cottage clusters across all neighborhoods.
■ Design Overlay Amendments (DOZA)—In June of 2021, this amendment updated the City of Portland’s design review process and regulatory tools. This means projects can move through the permitting process more quickly and have design flexibility. The resulting new zoning codes and map changes took effect on August 1, 2021.
■ Housing Regulatory Relief—As of 2024, a group of zoning codes now offer more flexibility on existing code requirements, such as bike parking, ground-floor active use, and upgrade timing. Some expirations on land use review decisions were also extended to March 1, 2025.
■ Inclusionary Housing Calibration — As of 2024, more locations in Portland allow development projects to expand their property tax exemption related to Portland’s inclusionary housing policies. This applies only to properties offering housing for residents at or below 60% of an area’s median income.
Want to Learn More About the Portland Housing Market?
Subscribe to our blog, or reach out. We’ve been selling homes in the greater Portland metro area and keep a close eye on the market. Bookmark our monthly reports. Our top 1% sellers agents and top 1% buyers agents would love to talk with you today. Give us a call at 503-714-1111 or chat with the bot on this site.
